Typically, a test automation engineer uses the main metric of test coverage, which shows how many tests are written. However, this metric does not consider the quality of the tests. ReportPortal will assist you with this. With our help, you can build a test automation metrics dashboard to achieve a balance between speed, reliability, and relevance in automated testing. This dashboard is specifically focused on automation metrics, not quality metrics like the QA metrics dashboard.
In ReportPortal, you can create two versions of a test automation metrics dashboard. The first one is Launch level, when we focus directly on a certain set of tests or on a specific execution. For it, we build a history and collect metrics. We gather information for launches, showing information on how a particular Launch is progressing, and all the metrics above it.
The second version of the test automation metrics dashboard involves aggregated widgets. Essentially, this dashboard centers around a unifying object: a build, a sprint, or a release.
Launch level dashboard
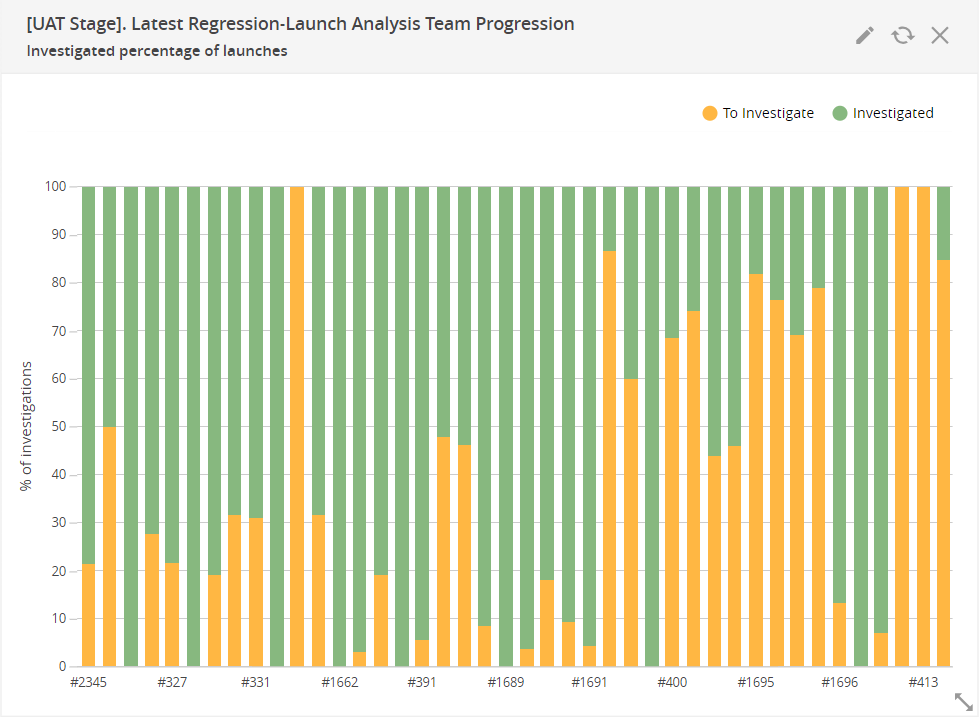
Investigated percentage of launches
Shows the number of items in launches with a defect type “To Investigate” and corresponding subtypes.
If there is a tendency not to deal with failed autotests, it means they are not useful.
Either automation engineers understand in advance that these errors are not serious, and it is not necessary explore “To Investigate”. Then the question arises, why these autotests were written, which do not make significant checks. After all, autotests should be of maximum benefit, all failures should be dealt with to indicate some kind of errors.
Therefore, with this widget, we can be confident that the team has reviewed and categorized all failures.
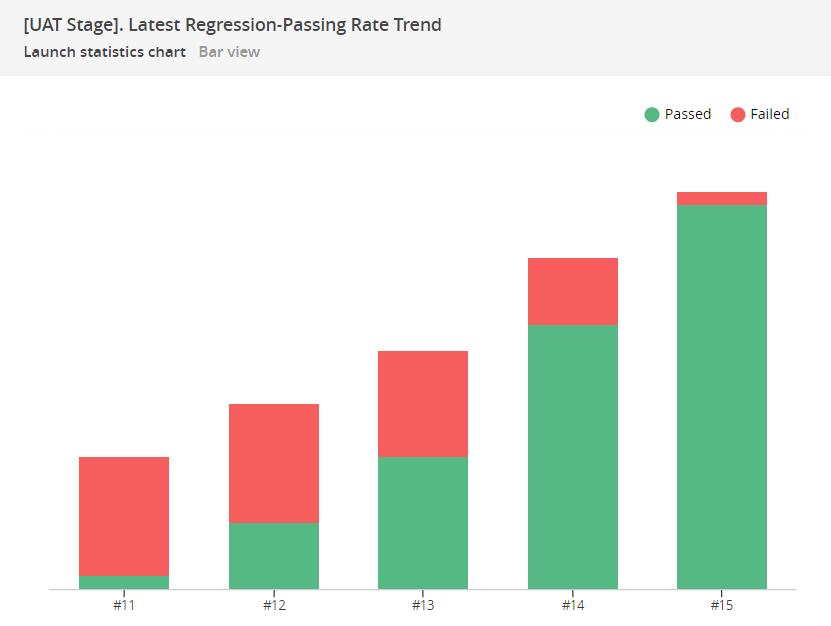
Launch statistics chart
As soon as this categorization appears, we get a new level of information – a distribution of failure reasons. We can simply look at the number of Failed and Passed tests.
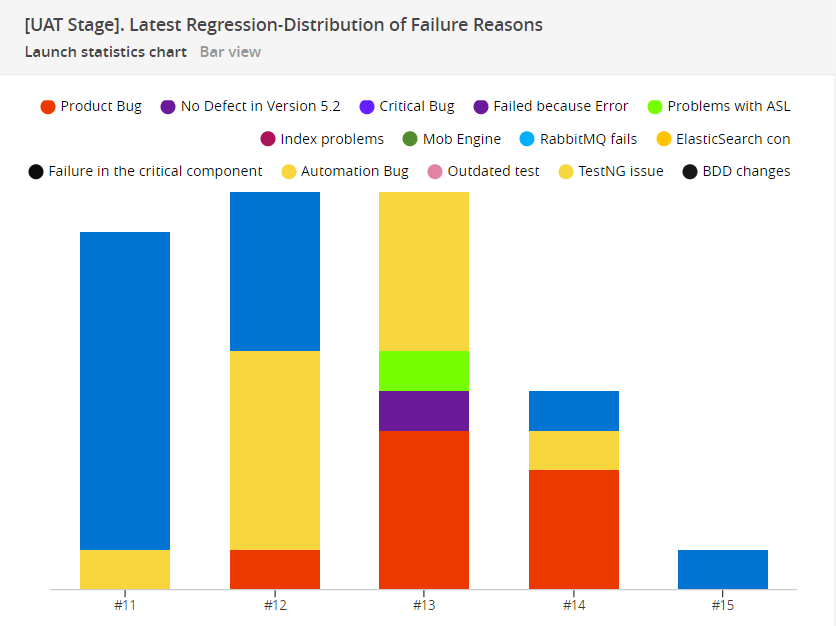
Or we can use ReportPortal's capabilities for categorizing failure reasons. This way we can understand the reasons why the tests didn't pass, and how many tests relate to each failure reason category.
There are three main groups of failures: Product Bugs, Automation Bugs, and System Issues.
System Issues. This is a category of problems related to technical debt of the infrastructure. One could say it is a DevOps debt, that is, the debt of the engineering team in setting up the infrastructure for flawless automation work.
What relates to the Automation Group – this is the technical debt of the automation team to fix all the problems, make automation stable, make locators stable, perhaps, update test suites.
Product Bugs with all its subcategories are those very test cases that help make the product better.
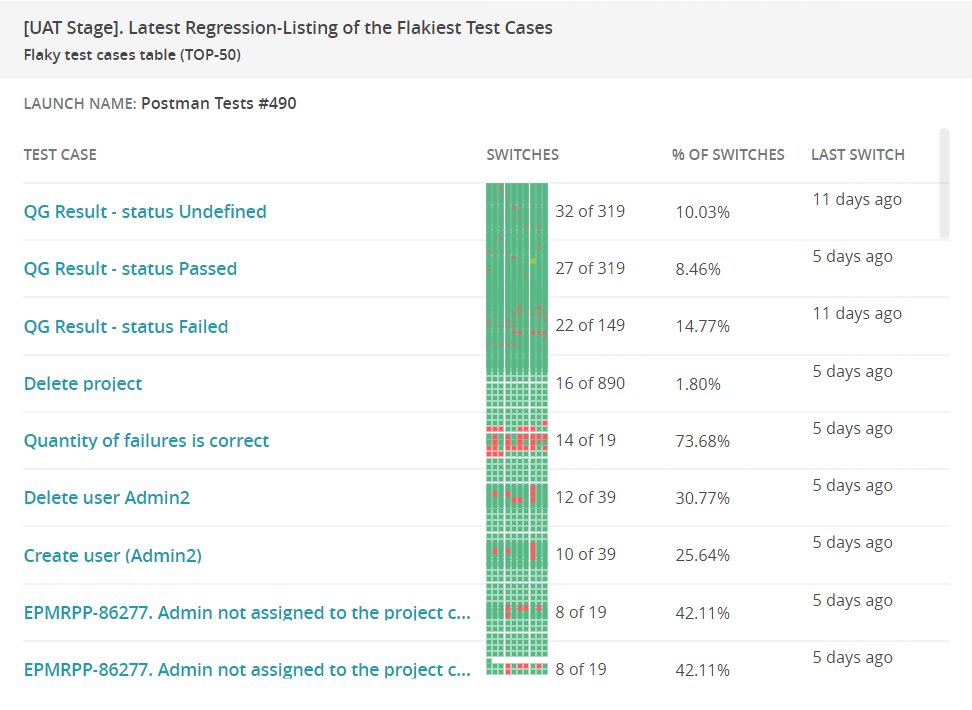
Flaky test cases table (TOP-50)
Shows 50 unstable tests in the specified launches. When setting up, you can specify whether to consider before and after methods.
This widget helps to identify unstable autotests that pass checks every time with a different status. Next, we need to understand: maybe it’s not the product itself, but the autotest? For example, there is no response from the server, and the test fails because there was no update on request.
One flaky test may not be a big problem, but several of them can certainly spoil the process. For example, if we then want to build Quality Gates that trigger automatic deployment after a health check, flaky test cases will hinder this capability.
It is recommended to fix the flakiest tests first, or even exclude them from the general run for some time.
Launches duration chart
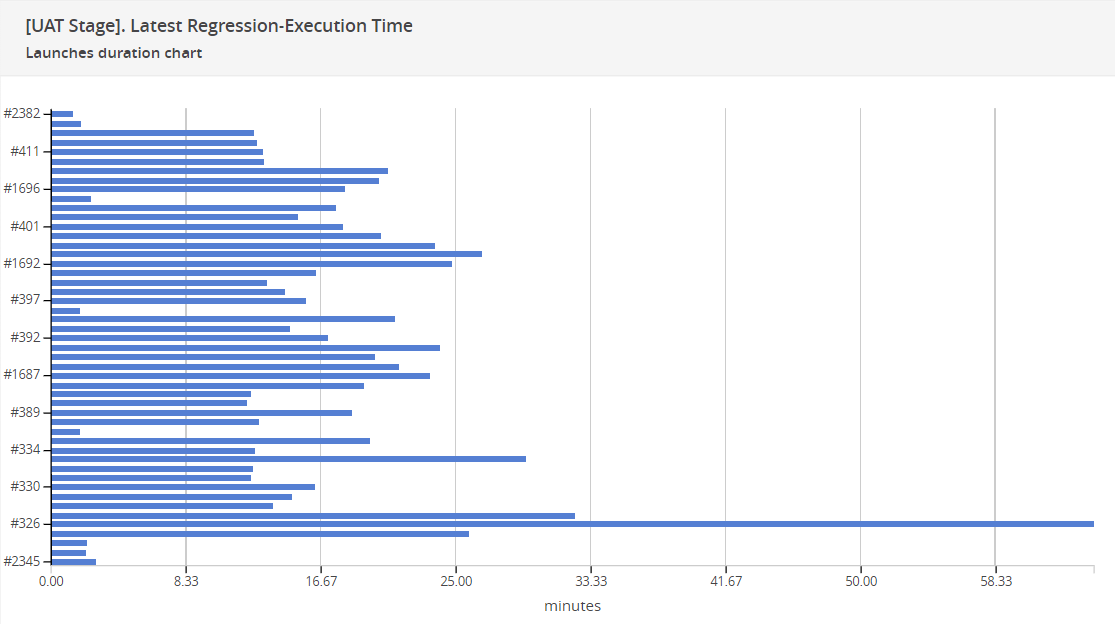
This widget shows the duration of the selected launches.
It’s best to build a filter for this widget based on launches of a certain direction, for example, regression, and against one environment. Then we can assess how automation is working and whether there is a scope of tests that stand out from the overall picture. Some launches may take too much time. For example, in the picture below, one launch lasted almost an hour. Next, we can look at the autotests in the problematic launch: maybe there is a test that takes a long time and the whole run takes a lot of time because of it. Perhaps it will be faster to carry out this check manually? Or, perhaps, it would be better to divide this large scope into several to speed up? Sometimes there is simply a lot of everything in one scope, and this is not always justified.
Some projects initiate extensive runs over the weekends, but good automation should still prioritize relative speed.
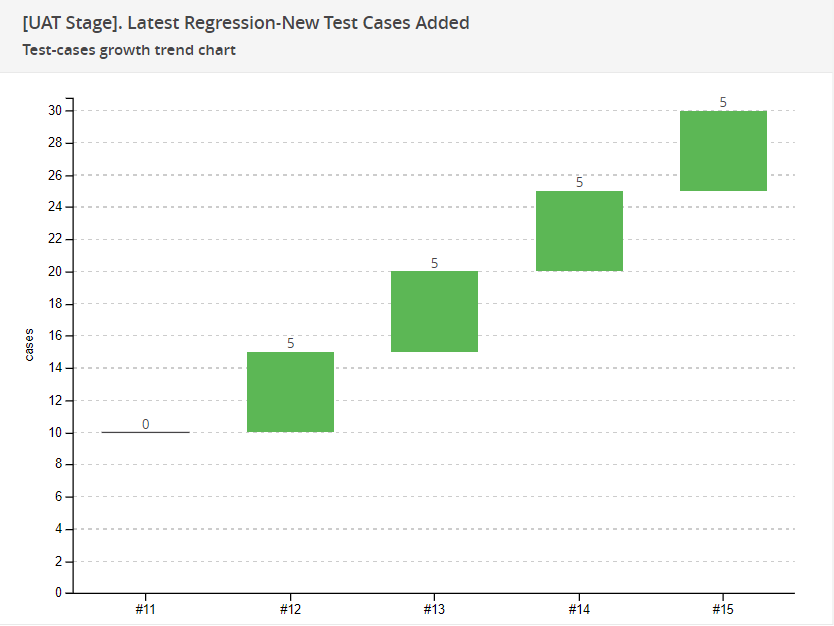
Test-cases growth trend chart
This chart shows how many new test cases have been written in each run. It allows observing if the team generally adds or excludes something from one run to the next.
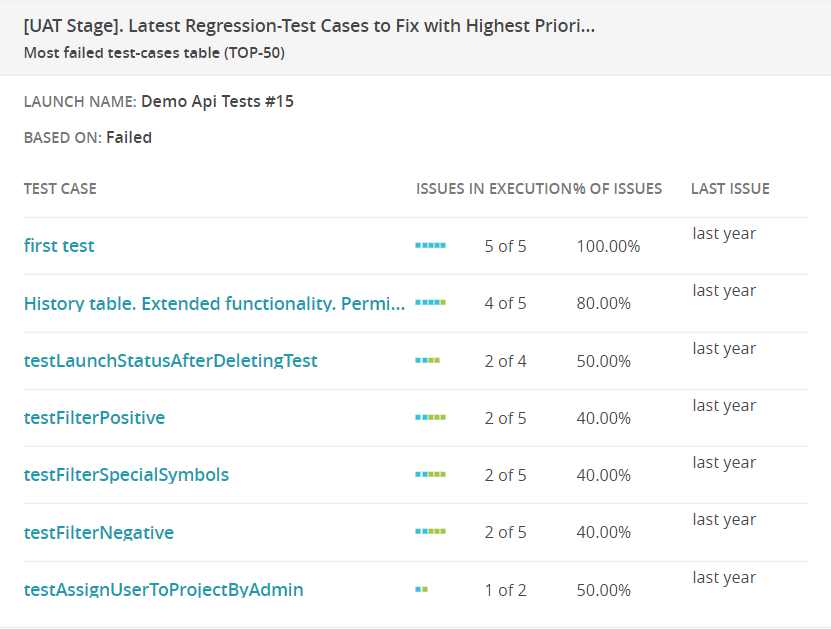
Most failed test-cases table (TOP-50)
Another important metric. If these tests fail for reasons other than Product Bugs, it means they are not testing the application, but are failing for some other reasons. It's necessary to verify why they failed and fix it.
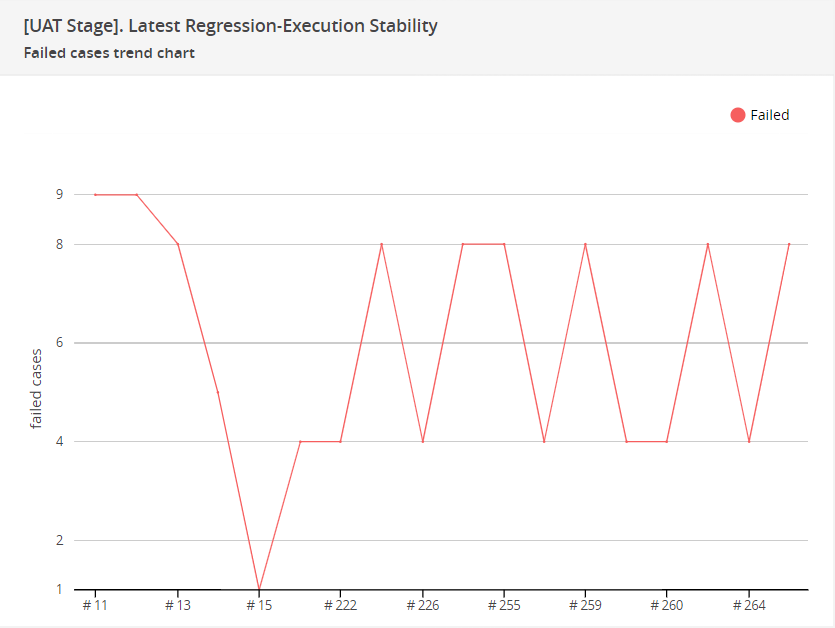
Failed cases trend chart
This widget will allow to understand whether the team is moving towards reducing the causes of failure or increasing them.
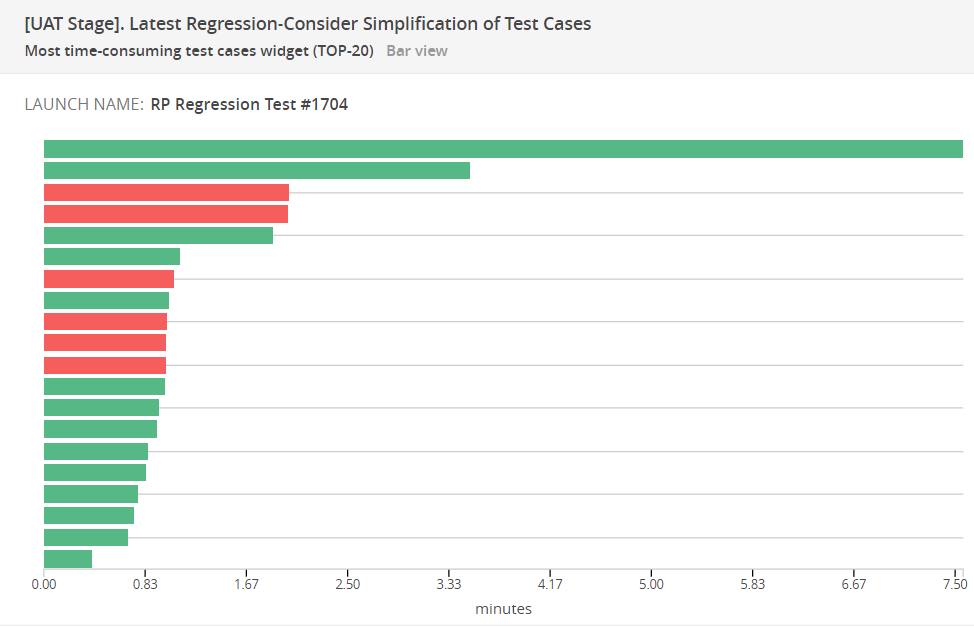
Most time-consuming test cases widget (TOP-20)
Shows test cases that take the longest time in the last run of the specified launch.
It's convenient to use it in combination with Launches duration chart: as soon as we see that the launch takes a long time, we build Most time-consuming test cases widget by the name of this launch and look which test cases take the longest.
In the example below, the longest test case takes almost 8 minutes. We should think about whether we can somehow reduce it. Or, if this test always passes, we can think about how relevant it is and whether such a check is needed. Perhaps this is already a stable feature, and the autotest no longer has much value, and then we can remove it from the scope and save 8 minutes on the run. And if the test takes a long time, and periodically fails, then we need to figure out what's wrong with it.
Aggregated level dashboard
Cumulative trend chart
This widget allows you to collect all launches related to a particular build, release, or version into a general data array and show how many Passed/Failed tests there are and the reasons for their failures.
For example, against the nightly build there were automatic jobs run that were related to API tests, integration tests, and end-to-end tests. We're interested in looking at the overall summary of the build, and how it passes. Not looking at individual jobs but looking at the summary of all results.
The widget can collect values by some attribute and show them over time. Accordingly, this way we can see how the stability of tests is improving. In the screenshot below, you can observe that initially most tests failed. The team started to add new test cases and stabilize the tests. At the second stage, you can see the emergence of System and Automation issues. Then, System Issues were fixed, remaining are Automation and Product Bugs, and so on until all failures decreased to a minimum value.

Overall statistics
The aggregated mode of this widget also can collect a summary of all launches that can relate to a build, a team, or any other object that we group.
Separately, you can look at the distribution of failure reasons.
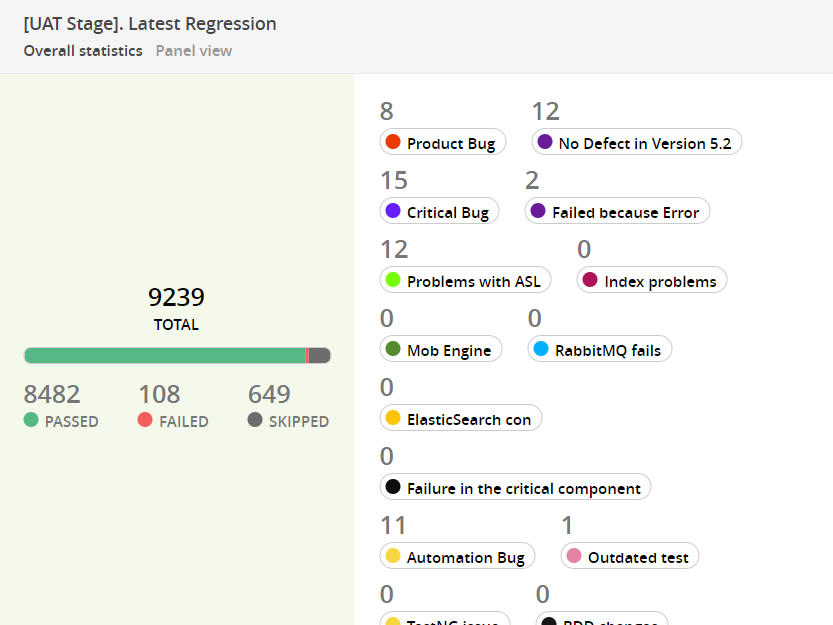
Table Component health check
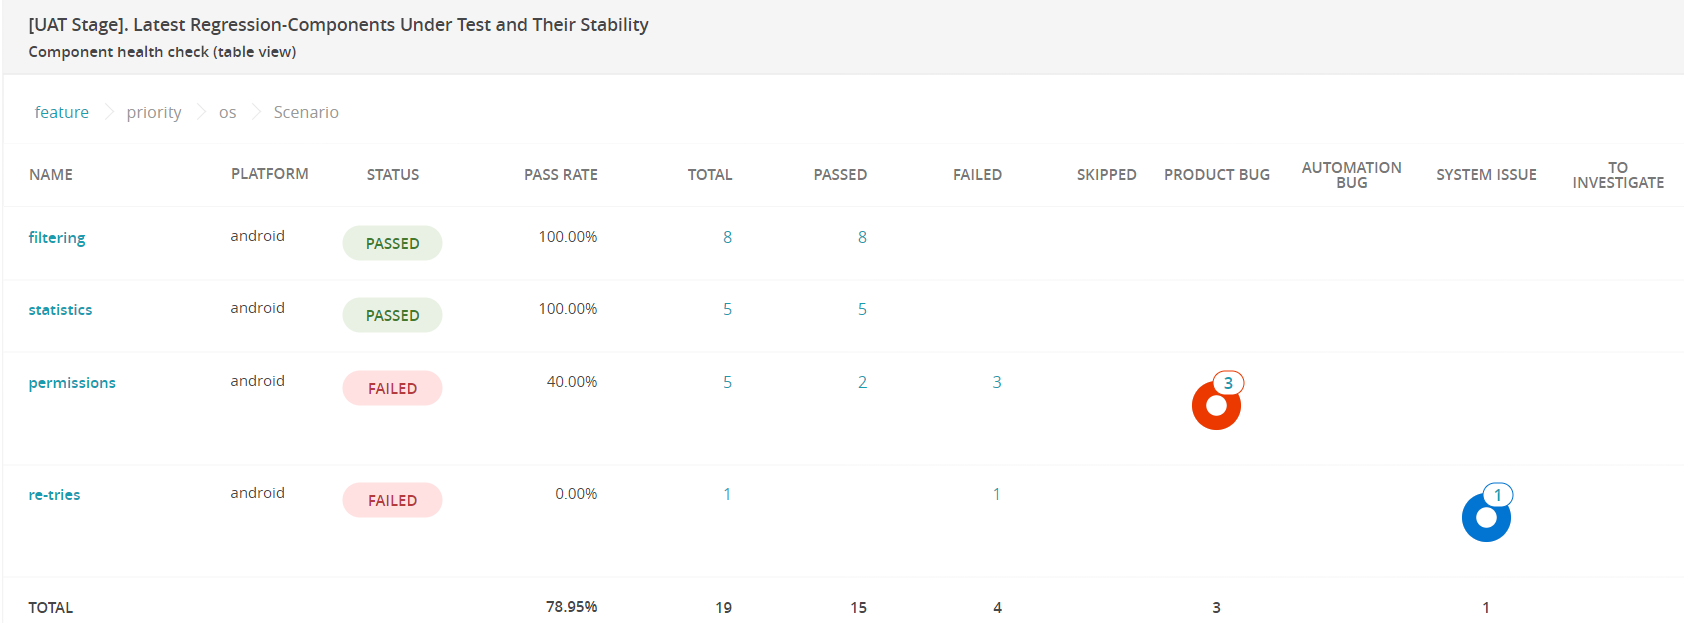
This widget allows you to view the state of the components we have tested. It can also look at the results of a specific build or selection.
The widget takes all the launches that fall into this selection, combines them into one common set of data, and subsequently can slice them by the attributes of the test cases that are in these launches.
In this case, at the first level are the features that are being tested. At the second level – split everything by priorities. At the third level – split by operating systems. At the fourth level – split by scenarios. Here you can add up to 10 levels. Including, you can add a custom column to see, for example, where the tests were run.
In this case, the features filtering, statistics, permissions, re-tries were tested. According to the settings, the Passing rate should be at least 70%, so the permissions component got a Failed status: out of 5 tests 3 tests failed, and they all relate to Product Bugs.
If we go deeper, we see that our tests are failing for critical functionality, medium and minor.
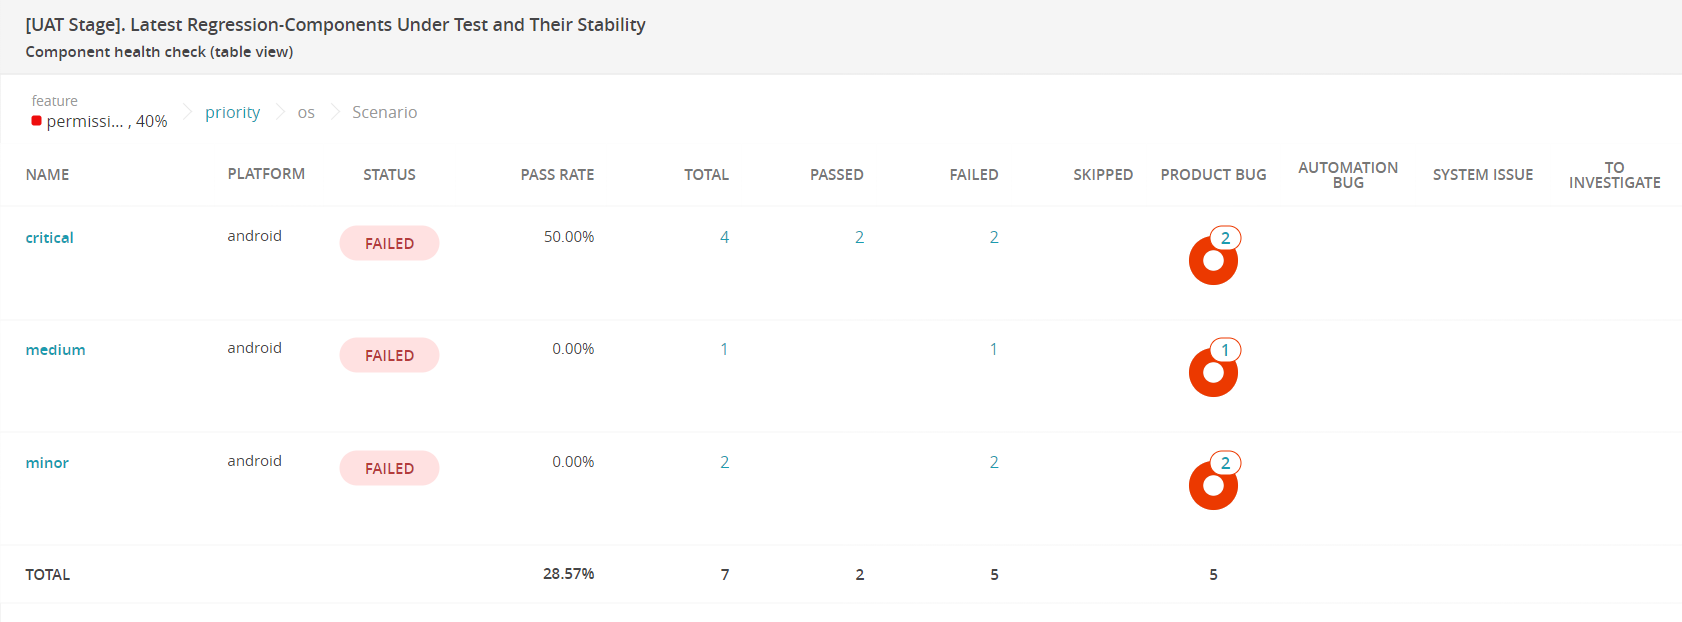
We go deeper, we see a distribution between Android and iOS. We go deeper and see that the user assign scenario is failing. We can go further and look at the selection of failed tests.

The widget gives us the possibility of granular viewing of all components and types of tests that were run. You can closely examine each specific component or critical functionality that has been tested.
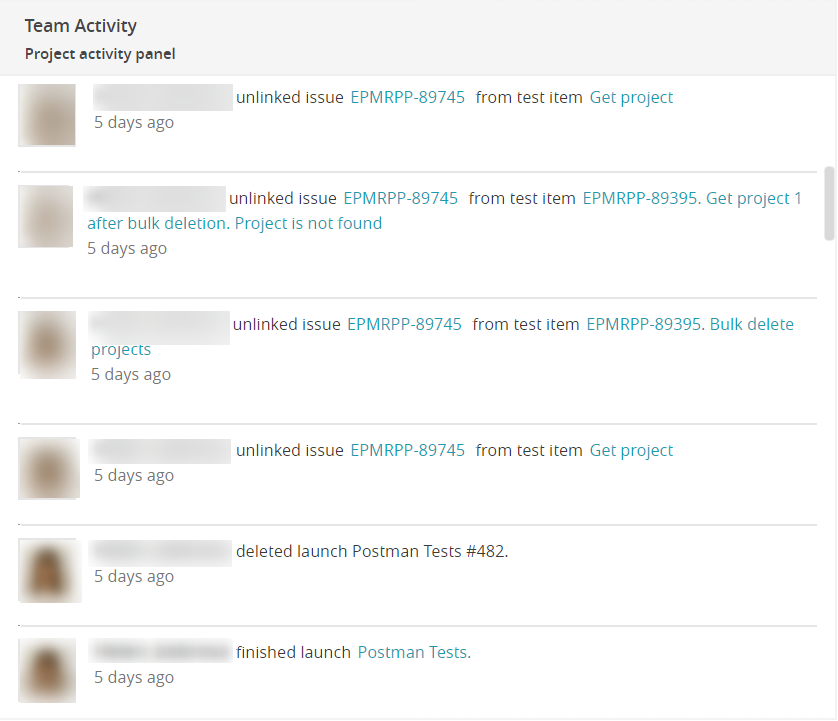
Project activity panel
This widget shows what was done on the project.
This widget is useful for the understanding who is working on what. Sometimes you go to a launch, and the defect types have already been set, some items are missing. You can go to the Project activity panel and see who worked with this launch.
Also, when building a widget, you can specify a user name and see the actions of someone specifically. For example, it is visible when the user launched the launch, when he finished it, when he did the import, when he created widgets/dashboards, or some project integrations, linked an issue.
Regular review and improvement of test automation metrics help identify areas that need enhancement. This process streamlines test automation workflows and provides insights for decision-making. Thanks to these metrics, organizations can deliver high-quality software products and remain competitive in the market.